摘要
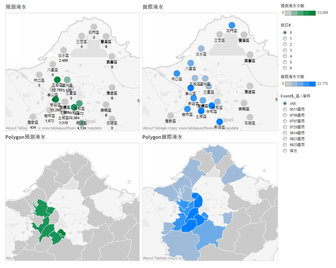
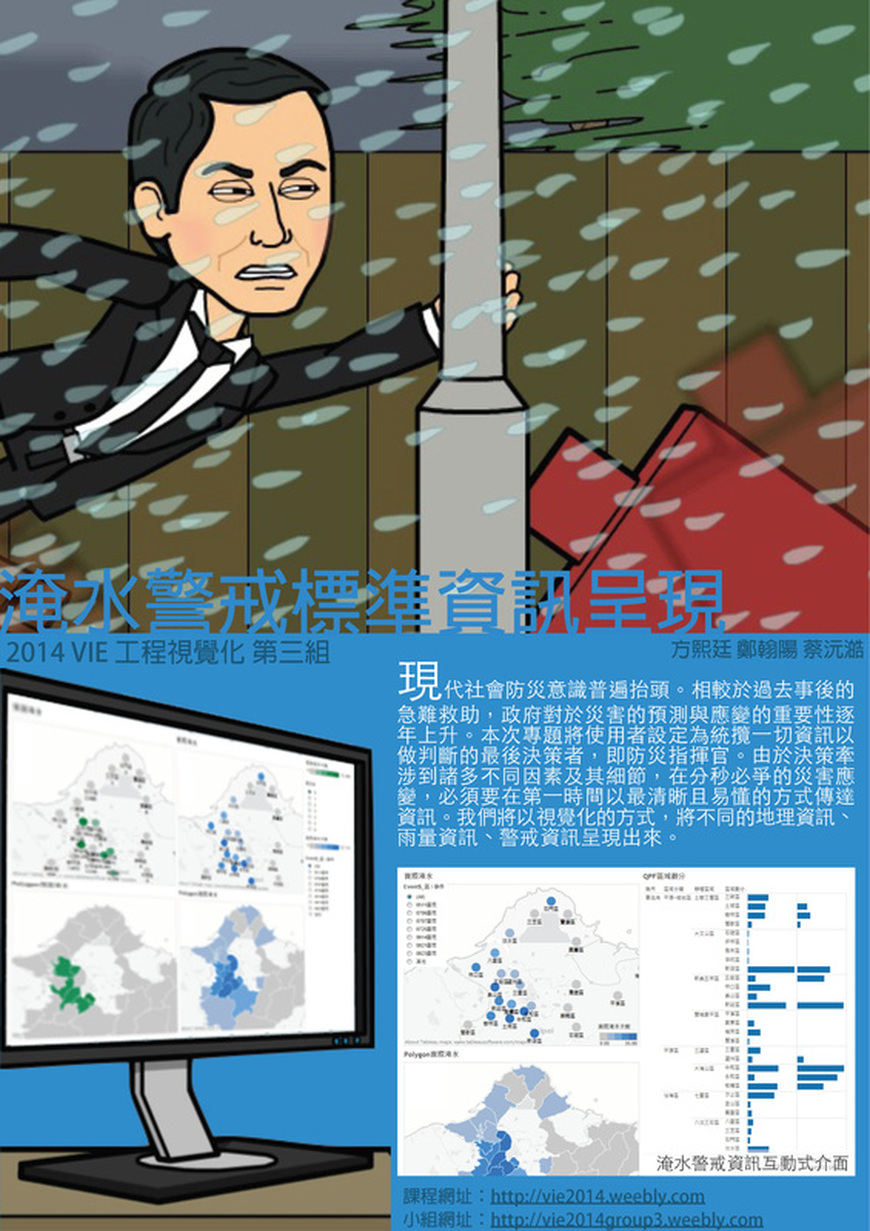
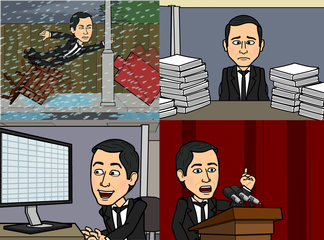
過去防災單位進行水災風災應變時,對於防災指揮官而言,面對龐大的資訊,包含歷史資訊、及時觀測資訊與災情資訊等,要在短時間內做出最適當的決策,必須有套良好的資訊系統進行視覺呈現。本研究開發一套「淹水警戒標準資訊呈現系統」,以新北市為範例,藉由分析水災最重要的歷史淹水災點資訊、水利署各區淹水警戒值、雨量預測(QPF)等資料,針對指揮官最常面臨的警戒發佈與疏散撤離決策,運用Tableau設計出一套檢視災害決策資訊的視覺化分析系統。
在此系統中,決策者可利用雨量預測資訊研判災情發生之頻率與地點分布,進行分類;同時利用歷史災點與災害事件資料,研判未來可能發生之災害地點,提供防災指揮官迅速而正確的決策參考依據。
在此系統中,決策者可利用雨量預測資訊研判災情發生之頻率與地點分布,進行分類;同時利用歷史災點與災害事件資料,研判未來可能發生之災害地點,提供防災指揮官迅速而正確的決策參考依據。
Abstract
When
disaster response commanders face typhoon
or flood disasters, they need to deal with massive
data, including historical information,
immediate observed information and disastrous
situation calamity information, etc., to make sure that the most appropriate decisions
to be made in a short time, they must
have a good information systems.
This research refers most commonly warning and evacuation decision patterns from past experiences of New Taipei City, and develops a unit of flood alert standard Information system by analyzing the most important historical flood point information, the Water Resources Agency flood warning value with all districts, rainfall forecast (QPF), and Tableau, which offers disaster respond commanders an efficient visual analysis system.
Disaster respond commanders can use rainfall forecast of this system to determine and categorize the frequency of occurrence of the disaster and its geographical distribution. In addition, this system uses the historical points of disaster and disaster event data to analyze disaster possible occur locations to provide quick and correct reference data when commanders need to make immediate decisions.
